Claims, Payroll, and Unemployment: Use in Practice

My two previous pieces on claims, payroll, and unemployment were dealing with introductory matters like defining the indicators (here) and exploring their popularity (here). This article discovers some of the practical applications these data are used for.
Visual Analysis
The first chart shows the unemployment level series along the initial claims starting from 1970, both are seasonally adjusted. It is patent that there is a connection between the two indicators. The lines on the chart do not match perfectly but in most cases a rise in unemployment is preceded by a rise in initial claims. And vice versa: a fall in unemployment has initial claims decreasing 1-3 months beforehand. From the common sense understanding, all seems correct. As initial claims accumulate most of them are transformed into actual unemployment benefit payments in the following weeks and months.
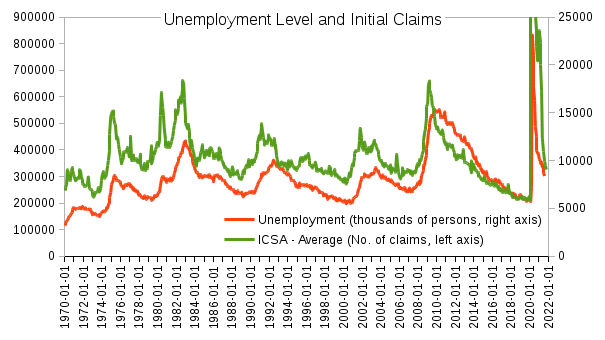
However, there are several major factors that make the match not perfect:
- not all of the people making initial claims become actually unemployed as some of them manage to find a job before the benefits start being paid;
- the initial claims add up to some level of unemployment that existed previously, i.e. the unemployed people who made their claims in the earlier months or years;
- initial claims account only for the increase in unemployment but there is an outflow from the unemployment that mainly consists of two parts:
- people who found a new job (there are complications to this mostly because of those employees who work part-time but would like to work more - the underemployed - but I'll leave this out of consideration here for simplicity of analysis);
- people who prefer to stop looking for work altogether (even more complications here as it can be hard to define those who do not want to work or account for the shadow non-official employment but again I will not talk about this to make analysis here simpler).
Regression Line
Okay, there is a link between initial claims and unemployment. But how to use it in order to calculate and forecast? For this, you normally run a regression on the existing data points. On the second chart, the unemployment data taken with a 1 month lag (on the vertical axis) is plotted against the initial claims data (on the horizontal axis). In addition, there are two regression lines presented: a linear and a logarithmic one. The corresponding equations and R-squared are also shown.
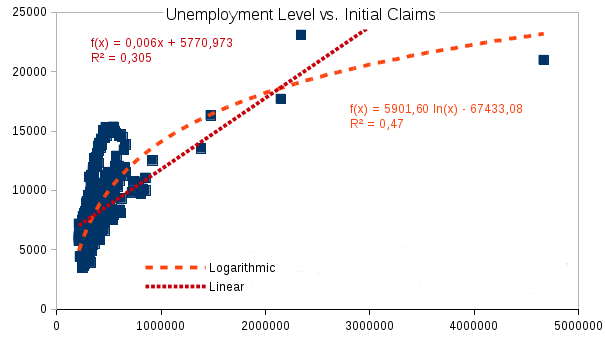 It is clear that while both regressions are far from ideally fitting the data, with some caution even these calculations can be used to make predictions about the unemployment behavior based on the initial claims information.
More Statistical Analysis
Looking at the second chart reveals several insights into the deficiencies of the unemployment-claims statistical nexus:
- notable outliers mostly being the data from the 2020-21 COVID-19 pandemic period;
- non-linear character of the connection mostly due to the outliers problem listed above but not limited to it;
- heteroscedasticity, which is the different variability of the data across the regression line with higher variability at higher values of both claims and unemployment.
Dealing with all of these issues requires using some more refined statistical techniques. Nevertheless, even the basic methods applied here allow to get some practical results from the data.
In conclusion, the initial claims data provide useful insights into the past and future behavior of unemployment. Combined with the weekly nature of its releases these data serve as an indispensable and popular source of information on the current state of the US labor market and the broader economy.